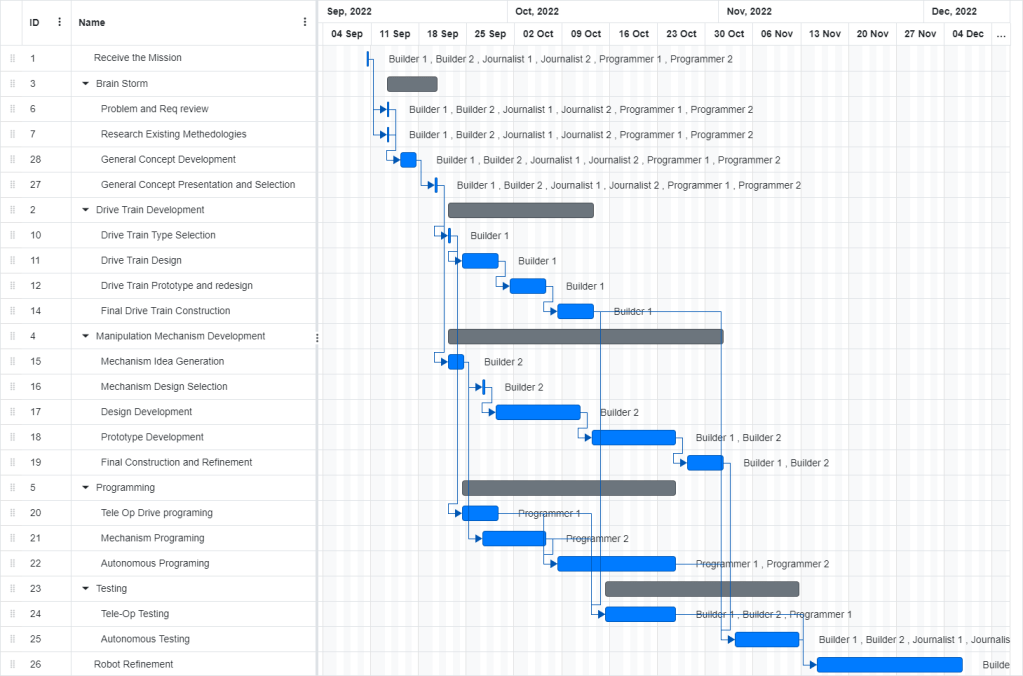
To aid in our project management, we at Trial and Error Robotics have recently employed the use of a Gantt chart. A Gantt chart is popular project management tool that acts as a visual representation of a team’s schedule along with the resources needed throughout it’s duration. It also displays how deadlines relate to our end goal.
The concept of a Gantt chart was created between the years 1910-1915 by a man named Henry Gantt. Although Gantt charts were originally hand drawn and referred to as a bar chart, several programs have been created to make digital Gantt charts as technology has advanced. Two examples of these programs include Microsoft Project and Online Gantt (which is what the team uses). With a Gantt chart, you can create sections depending on the subsections within the task. Additionally, a Gantt chart enables assigning roles to the individual tasks contained therein.
In order to keep the team moving forward in an organizational pattern, we adopted the use of a Gantt chart. The concept was introduced to us by our mentor Mark, a project management professional with a masters in the field. He gave a presentation on the importance and benefits of project management in a team oriented environment. Although it is not unique to our team, we have struggled with time management in past seasons. Thus far, the Gantt chart has aided the team to stay on track along with making routine entries for our engineering notebook.
